Debug the project
Debug with Visual Studio Code
Debugging involves two phases:
-
First, define the breakpoints with the associated conditions and actions within the standard Visual Studio Code interface.
-
Then, launch the debugging session while the sketch is running on the board.
Check the configuration
Debugging requires a board with a built-in debugger or a board connected to an external debugger.
Examples of boards with a built-in debugger include Arduino M0 Pro, LaunchPad, BBC micro:bit, Microsoft Azure IoT DevKit.
Examples of boards connected to an external debugger include ESP32 board with the external ESP-Prog programmer-debugger, Adafruit Feather nRF52840 with the Segger J-Link emulator.
Debugging relies on the Cortex-Debug extension.
Define the breakpoints
- Use the Visual Studio Code interface to define breakpoints with the associated conditions and actions.
For more information about debugging with Visual Studio Code,
- Please refer to Debug C++ in Visual Studio Code and Configure C/C++ debugging .
Power the board with the Segger J-Link debug probe
Some Segger J-Link debug probes can power the board with +5 V (300mA maximum, pin 19), while the logic level is set through VTref (target reference voltage, pin 1).
- On the main
Makefile, set the variableJLINK_POWERto1.
JLINK_POWER = 1
Alternatively,
-
Open a Terminal window.
-
Launch JLinkExe.
JLinkExe
The prompt is displayed.
J-Link>
- Enter the corresponding command.
 power on
 exit
- Or enter the corresponding command on Ozone.
Edit.SysVar(VAR_TARGET_POWER_ON,1);
For more information,
- Please refer to the section JTAG Interface Connection (20 pin) on the page Interface Description .
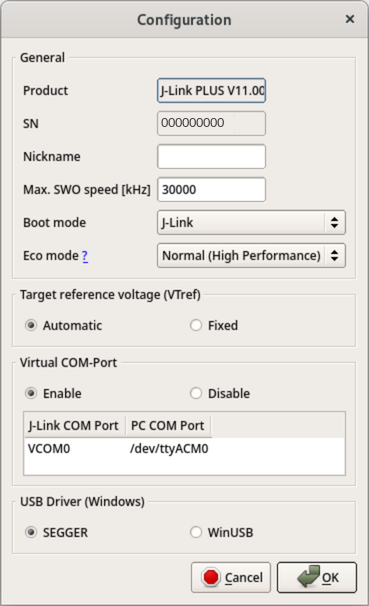
Re-route a serial console through the Segger J-Link debug probe
Additionally, some Segger J-Link debug probes feature VCOM and re-route a serial console through J-Link TX (pin 5) and J-Link RX (pin 17).
This feature is only valid with SWD and is disabled by default. To enable it,
-
Connect the Segger J-Link debug probe.
-
Launch JLinkConfig.
-
Select the debug probe and call the contextual menu Configure.
-
Click on Enable below Virtual COM-Port, then on OK.
-
Power-cycle the debug probe.
Alternatively,
-
Open a Terminal window,
-
Launch J-Link.
JLinkExe
The prompt is displayed.
J-Link>
- Run the following commands after the
J-Link>prompt.
vcom enable
exit
If the probe has the serial number 123456789, the serial port is re-routed to /dev/tty.usbmodem000123456789.
-
Open a Terminal window.
-
Launch the following command with the correct speed.
screen /dev/tty.usbmodem000123456789 9600
To disable it,
- Proceed as before, but select Disable below Virtual COM-Port instead.
Alternatively,
-
Open a Terminal window,
-
Launch J-Link.
JLinkExe
The prompt is displayed.
J-Link>
- Run the following commands after the
J-Link>prompt.
 vcom disable
 exit
For more information,
- Please refer to the section VCOM Functionality on the page J-Link Debug Probes .
Add support for RTOS
Plug-ins bring RTOS support on Ozone.
- Enter the corresponding command.
Project.SetOSPlugin("FreeRTOSPlugin_CM4");
For more information,
- Please refer to the page RTOS aware debugging .
Launch the debugging session
To launch the debugging session, the first time,
-
Press Ctrl+Shift+D to display the debug pane;
-
Select the configuration on the drop-down list;
-
Hit Start Debugging or press F5.
After the first time,
- Press the short-key Ctrl+Shift+D.
Manage specific boards
Some boards require a specific procedure.
- Please refer to the Debug section for the board under Manage the boards.
Debug the project with Ozone
![]() A great alternative for debugging is Ozone with a Segger J-Link debugger. Ozone provides a GUI to program and debug a board.
A great alternative for debugging is Ozone with a Segger J-Link debugger. Ozone provides a GUI to program and debug a board.
For more information about the platforms and MCUs supported,
- Please refer to the page Supported Devices - J-Link .
For some boards running on FreeRTOS, Ozone manages FreeRTOS better than the command-line J-Link utility and is thus strongly recommended.
For more information on how to use Ozone,
- Please refer to the Ozone User Manual (UM08025) from Segger.
For more information about the debugging tools,
- Please refer to the Segger J-Link and Segger Ozone documentations.